Explainer
Explainer helps you diagnose and understand optimization models faster by combining automated model analysis, Gurobi’s curated knowledge base, and the business context you provide. It offers three predefined use cases: diagnosing infeasibility, restoring feasibility, and analyzing model sensitivity.
Business context is a first-class input. The same constraint may be non-negotiable in one setting and easily adjusted in another—a physical law or safety limit cannot move, while a target inventory level or a staffing preference often can. By telling Explainer which constraints and variables reflect hard realities and which are policy choices, you help the agent rank the candidates that are actually worth modifying and skip the ones you cannot or will not change.
This is why it is worth uploading the supporting material you already have: business-context documents, specification or design documents, and even partial source code. The more Explainer knows about what the model represents and why each piece is there, the more targeted and trustworthy its diagnosis and remediation suggestions will be.
Features
Three Predefined Use Cases: Diagnose infeasibility with the IIS, restore feasibility with FeasRelax, and quantify how much your inputs can shift before the optimum changes with sensitivity analysis—each driven by Gurobi’s automated routines under the hood.
Easy Model Ingestion: Upload a model file in plain text or compressed form for any use case. For infeasibility diagnosis, Explainer computes the IIS automatically from the model file. If the model is too large or the computation would take too long, you can generate the ILP file locally and upload it directly instead.
Context-Aware Analysis: Attach supporting files—source code, specifications, or domain documentation—so the agent interprets your model in the context of your actual business problem and identifies which parts are realistic to change.
Targeted Clarification: Explainer asks precise follow-up questions to fill gaps, sharpen its analysis, and avoid generic recommendations.
Gurobi-Backed Analysis: Leverage Gurobi’s deep optimization expertise and curated knowledge base to surface patterns and insights that general-purpose tools miss.
Structured, Actionable Output: Get a ranked, human-readable breakdown of root causes, repair plans, or sensitivity ranges—tied to both your model and your use case—with concrete next steps you can apply immediately. For infeasibility diagnosis, Explainer also produces a downloadable Markdown report saved to the workspace.
Background
Infeasibility
A mathematical optimization model is infeasible when no solution exists that satisfies all of its constraints and variable bounds simultaneously. This typically happens when two or more requirements contradict each other—for example, a constraint that demands a variable be at least 100 combined with a bound that limits the same variable to at most 50. Infeasibility can also arise from data errors, overly restrictive business rules, or incorrect model formulations.
Diagnosing infeasibility manually can be extremely difficult, especially in large models with thousands of constraints. Gurobi provides built-in tools to help isolate the source of the conflict.
Irreducible Inconsistent Subsystem (IIS)
When Gurobi detects that a model is infeasible, it can compute an Irreducible Inconsistent Subsystem (IIS)—the smallest subset of constraints and variable bounds that still forms an infeasible system. Removing any single element from the IIS would make the remaining subset feasible, which means every element in the IIS contributes to the conflict.
The IIS is the starting point for understanding why a model is infeasible. By focusing on this minimal set rather than the entire model, you can efficiently identify the root cause and decide which constraints or bounds to relax, modify, or remove.
ILP Files
An ILP file is the standard file format for representing an IIS. It contains only the constraints and variable bounds that belong to the irreducible inconsistent subsystem, written in a human-readable LP format.
When you upload an infeasible model, Explainer computes the IIS automatically.
If the model is too large or the IIS computation would take too long, you can
generate the ILP file locally and upload it directly. You can do this using
the Gurobi command-line tool, the gurobipy API, or other Gurobi interfaces.
For example, using the command line:
gurobi_cl ResultFile=model_iis.ilp model.mps
Or programmatically in Python:
model.computeIIS()
model.write("model_iis.ilp")
Explainer also accepts compressed ILP files in gz, bz2, zip,
7z, and xz formats.
Feasibility Relaxation (FeasRelax)
Identifying why a model is infeasible is only half the job—you usually also need to know what to change to make it feasible again. Gurobi’s FeasRelax procedure answers that question. It searches for the smallest set of adjustments to constraint right-hand sides and variable bounds that restores feasibility, and reports both the adjustments and the resulting feasible solution.
You can configure FeasRelax to minimize the number of violations, the total violation, or the squared violation, and you can restrict relaxation to a specific subset of constraints or variables when only certain parts of the model are negotiable. The output is an actionable repair plan—a concrete list of which right-hand sides or bounds need to shift, and by how much— that you can review against your business context before applying any change.
Sensitivity Analysis
Once a linear program has been solved to optimality, sensitivity analysis quantifies how robust that solution is to changes in the input data. It uses information from the optimal basis to answer questions such as:
How much can a constraint’s right-hand side change before the current set of binding constraints—and the corresponding solution—changes? The associated shadow price measures how much the objective would improve per unit of additional capacity within that range.
How much can a variable’s objective coefficient change before that variable enters or leaves the optimal basis? For a variable currently at one of its bounds, the reduced cost measures the gap between its coefficient and the value at which it would become attractive enough to use.
Sensitivity analysis currently only applies to linear programs and requires a basic optimal solution. It gives you a quantitative view of where the model is tight and where it has slack, so you can focus attention on the inputs that actually move the answer.
Using Explainer
To open Explainer, click Explainer in the left sidebar or select the Explainer card from the home page.
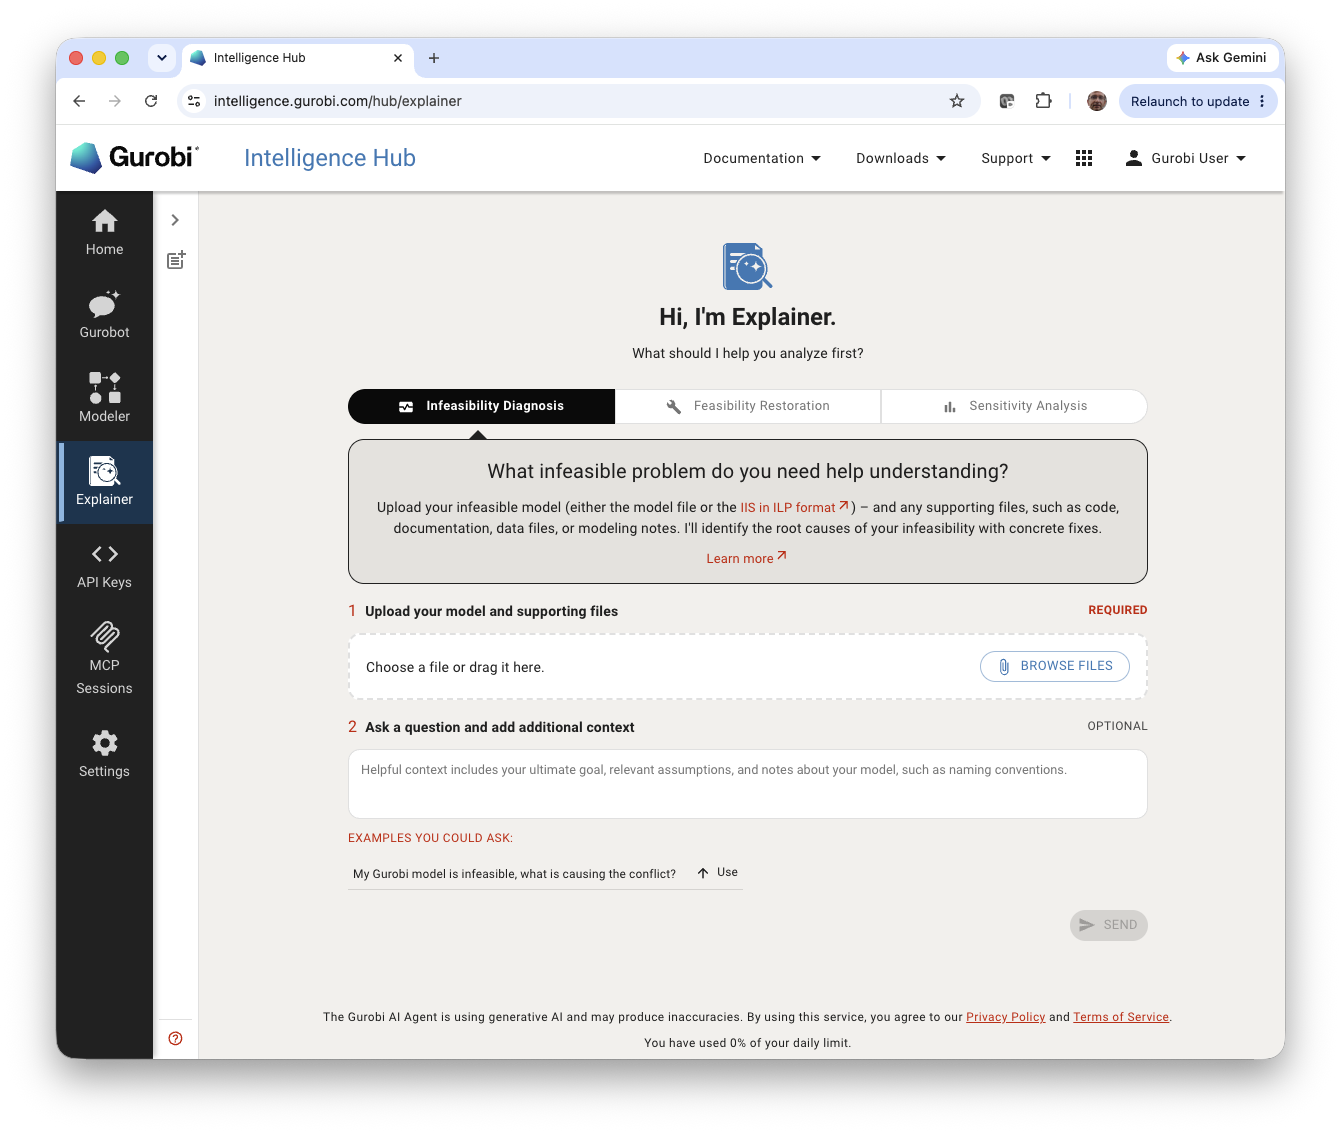
Explainer provides three predefined use cases to guide your analysis. Select the one that matches your situation to get started.
Infeasibility Diagnosis
Infeasibility Diagnosis identifies why your model has no feasible solution. It analyzes the IIS from your ILP file, pinpoints the conflicting constraints and bounds, and produces a ranked report of probable root causes with concrete remediation options.
Uploading Files
Explainer accepts multiple files to provide a thorough analysis:
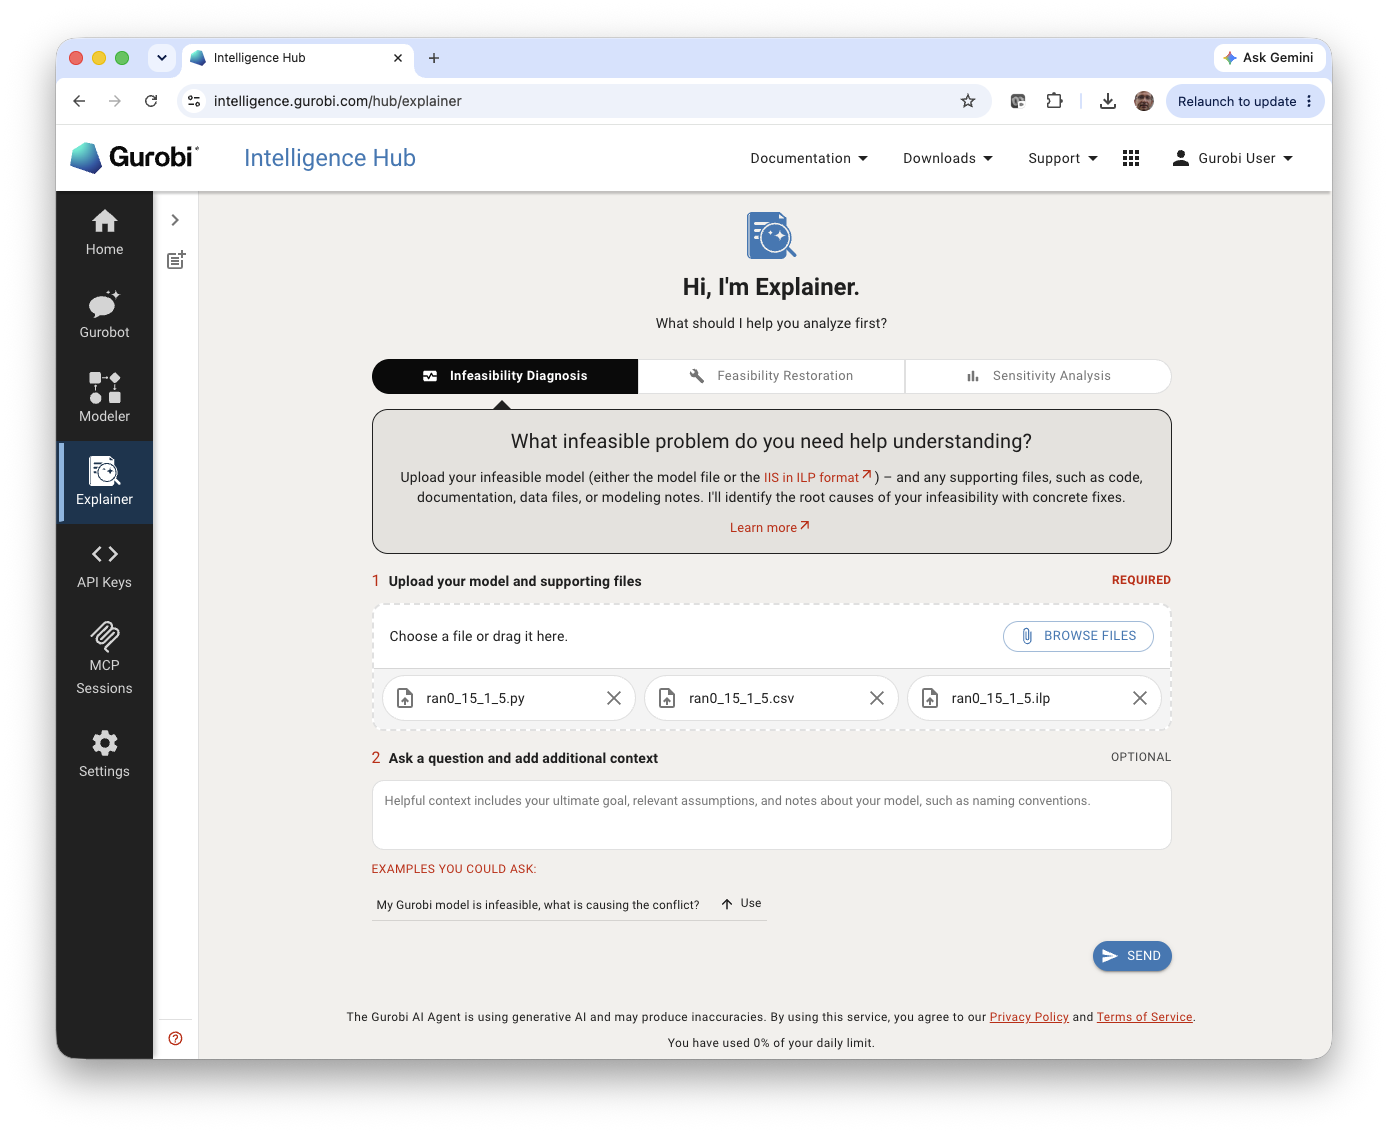
Model file (required): The infeasible model file. Explainer will compute the IIS automatically. Alternatively, if the model is too large or the IIS computation would take too long, you can upload a precomputed ILP file directly.
Supporting files (optional): Additional context files such as source code, CSV data, or domain documentation that help Explainer interpret your model.
To upload files, either drag them into the upload area or click the BROWSE FILE button. Once your files are attached, click the ANALYZE button to start the analysis.
Reviewing the Analysis
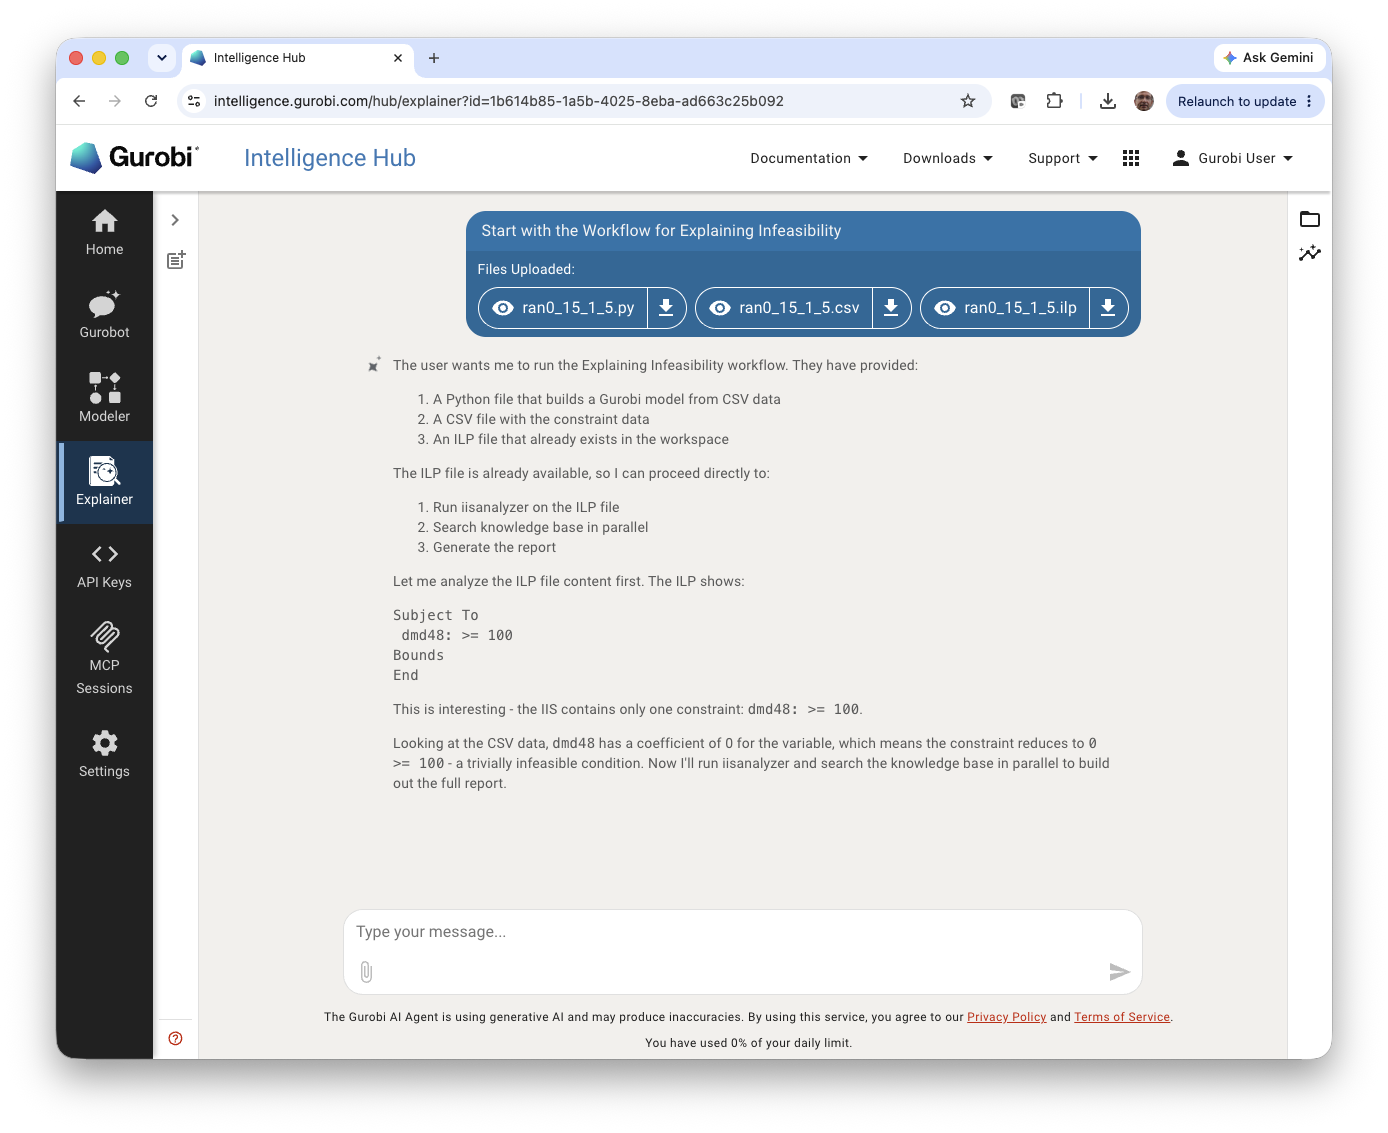
Explainer processes your files and produces a detailed analysis. The response includes:
A summary of the uploaded files and their contents
Identification of the constraints in the IIS
Root cause analysis explaining why the model is infeasible
Follow-up questions to refine the diagnosis
Links to relevant Gurobi documentation with relevance ratings
Infeasibility Report
Explainer generates a downloadable Infeasibility Analysis Report. The report is saved to the conversation workspace and appears as an attachment in the chat message. Click on it to open the report in a side panel alongside the conversation, or use the Copy and Download buttons to save it for offline review.
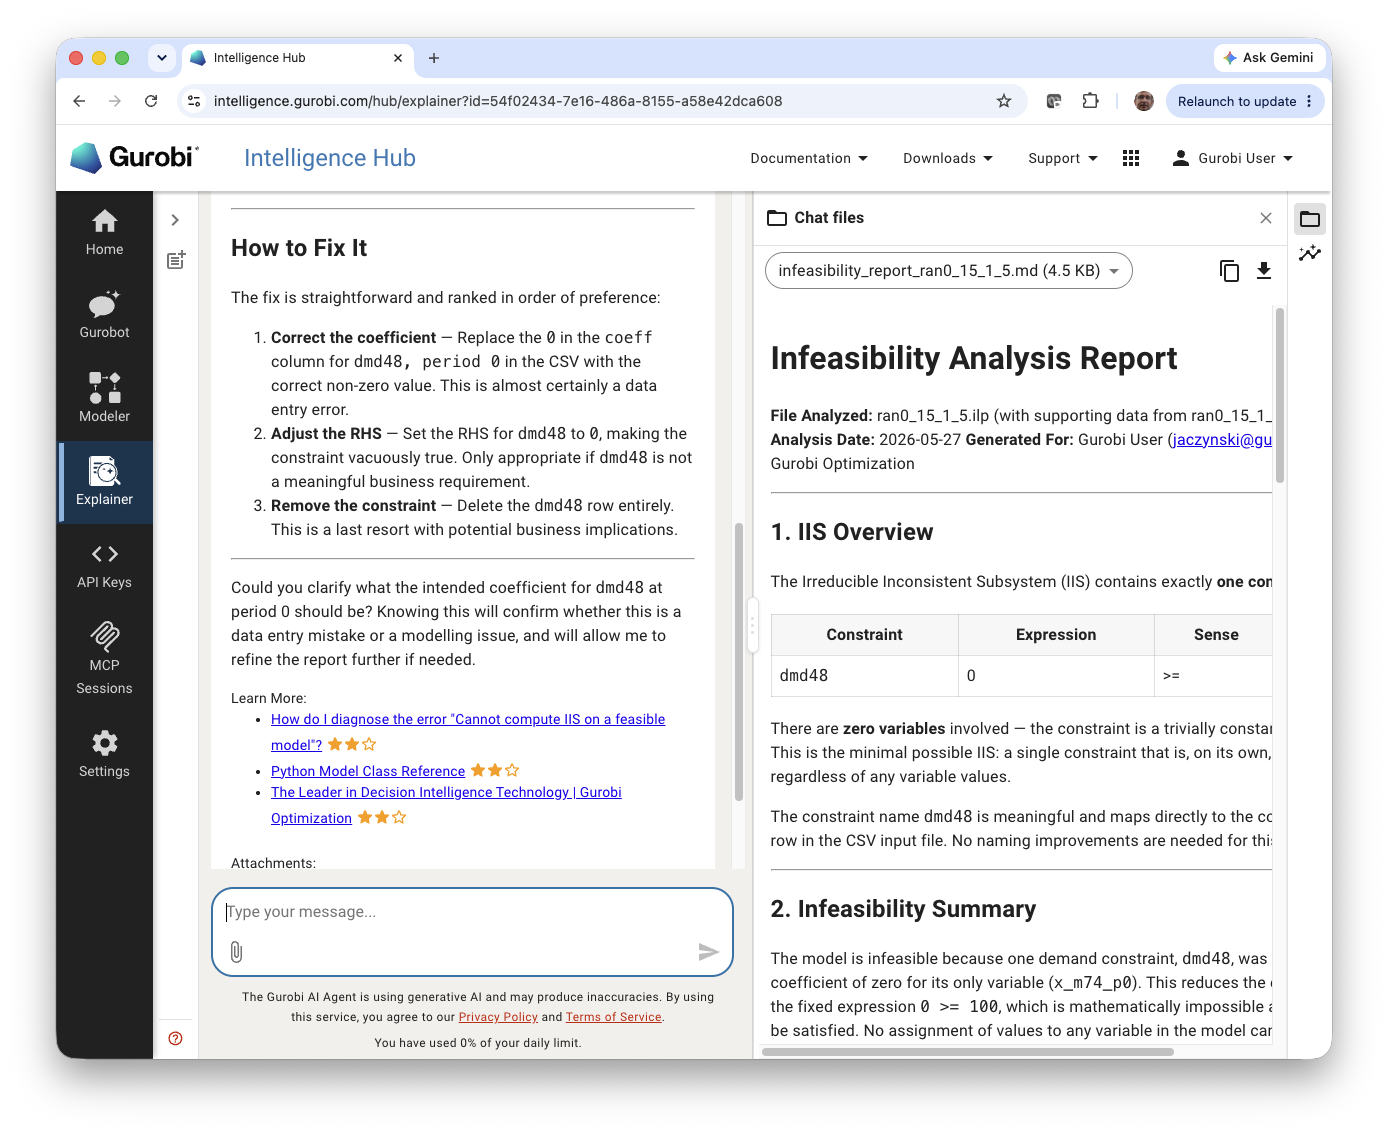
The report includes:
IIS Introduction: A description of the constraints and variable bounds identified in the IIS, grouped by type and pattern. Notes where constraint naming could be improved for better interpretability.
Infeasibility Summary: A concise, plain-language explanation of why the model is infeasible.
Detailed Analysis: A mathematical walkthrough showing exactly how the identified constraints and bounds contradict each other.
Remediation Options: Concrete, prioritized suggestions for resolving the infeasibility—such as adjusting right-hand-side values, relaxing variable bounds, or removing constraints—ranked by effectiveness and minimal disruption to the original model.
The response also includes follow-up questions to help refine the diagnosis and links to relevant Gurobi documentation with relevance ratings. You can continue the conversation by typing follow-up questions in the message field to get additional guidance.
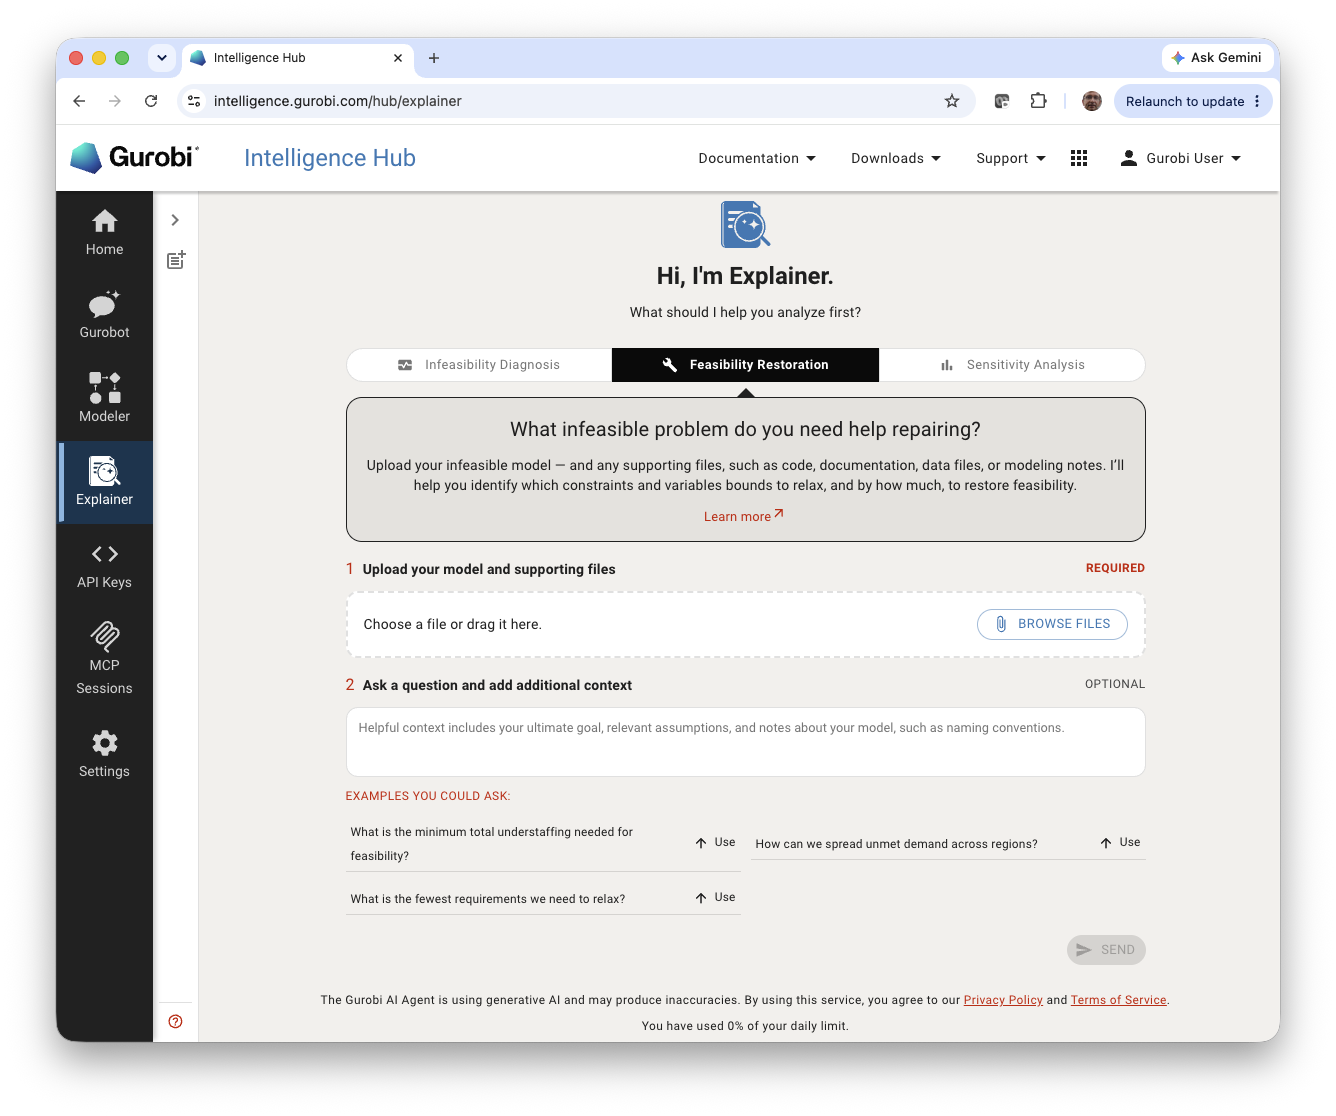
Feasibility Restoration
Feasibility Restoration goes beyond identifying what is wrong—it computes the smallest concrete set of changes to your model that would make it feasible again. Rather than leaving you with a diagnosis and a blank page, it tells you exactly which constraint right-hand sides or variable bounds need to shift, and by how much, so you can evaluate the trade-offs and decide which adjustments are acceptable in your business context.
You can focus the analysis on a specific subset of constraints or variables, or allow the agent to consider the full model. The result is an actionable repair plan you can apply directly to your model.
Sensitivity Analysis
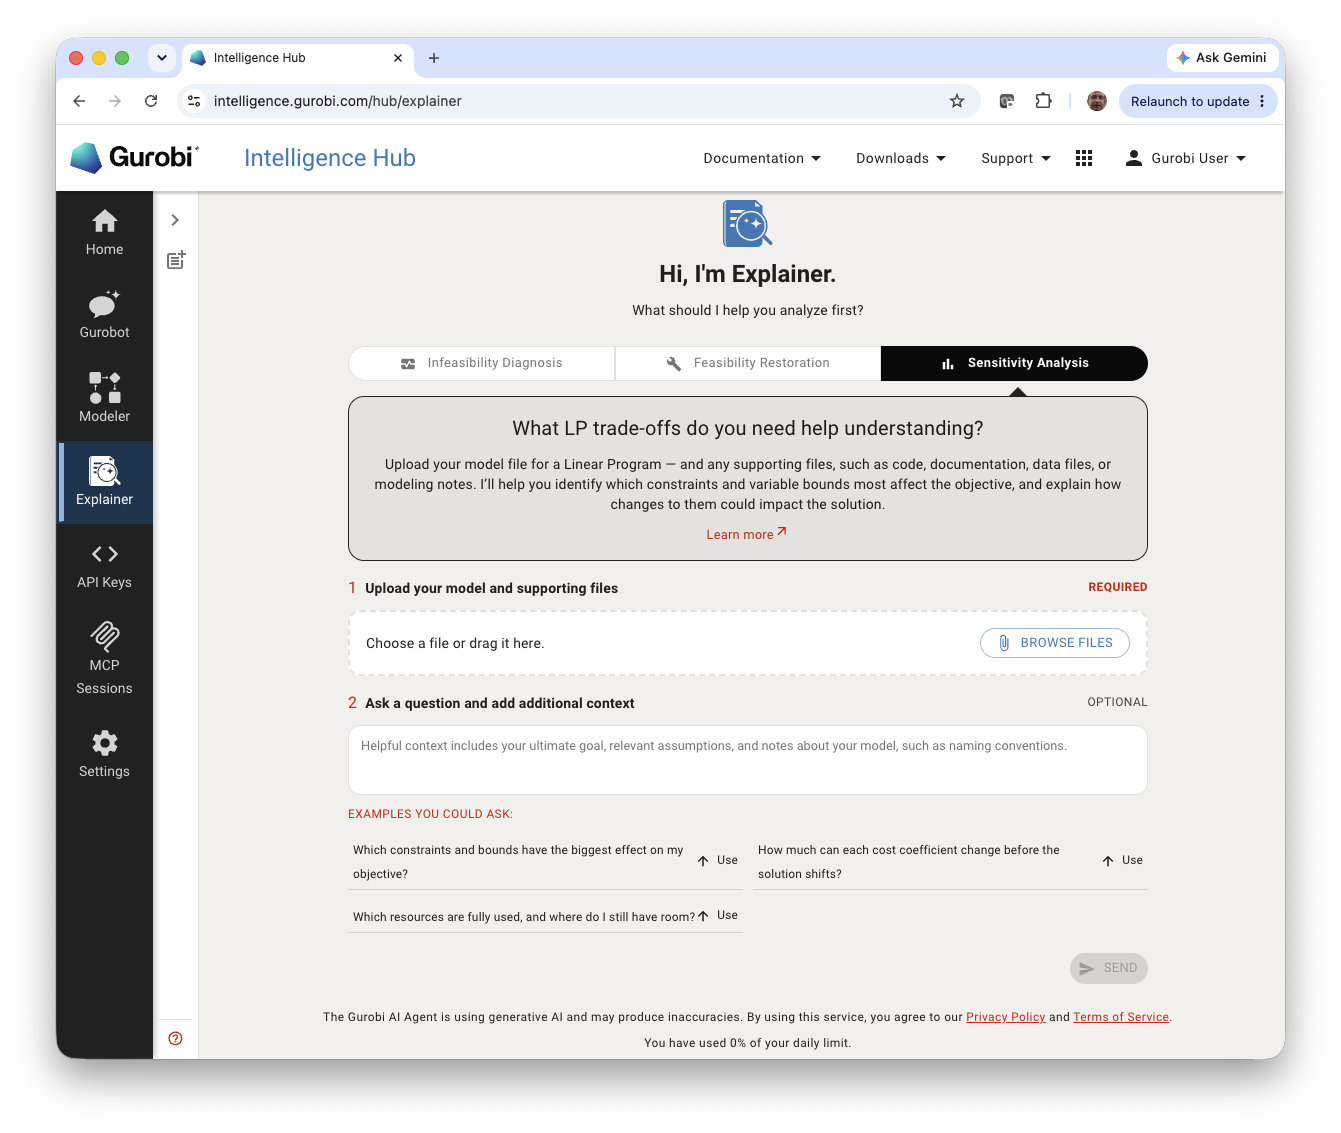
Sensitivity Analysis answers the question: how fragile is my optimal solution? Given a model that has already been solved to optimality, it measures how much each input—objective coefficients, constraint right-hand sides, and variable bounds—can change before the current solution is no longer optimal.
The analysis produces two complementary views:
Binding constraints: which constraints are active at the optimum, how much the objective would improve per unit of additional capacity (shadow price), and over what range of the right-hand side that shadow price remains valid.
Variable sensitivity: for variables that are fixed at a bound, how far the objective coefficient would need to shift before that variable would enter the solution (reduced cost and break-even point). For variables already in the solution, the range of their objective coefficient and bounds over which the current basis stays optimal.
This gives you a precise, quantitative picture of where the model is flexible and where it is tight, so you can focus attention on the constraints and decisions that matter most.
Note
Sensitivity Analysis currently only applies to linear programs (LP). It requires a basic optimal solution.
Managing Conversations
Like Gurobot, Explainer maintains a history of your analysis sessions. Use the sidebar panel to start a new chat or revisit previous analyses. Each chat has a … menu that lets you Rename or Delete the conversation.