Cluster Jobs
A job is an optimization task performed on behalf of a client. Running a job requires server resources, which must be provisioned in the cluster. If no resources are available, a job can be queued for later processing.
There are two types of jobs:
Interactive jobs handle optimization sessions controlled by a client in real time. The client must stay connected for the duration of the session.
Batch jobs are also generated by a client, but for offline processing. The client uploads a batch specification to the Cluster Manager containing the input data needed for the optimization task. When the job later runs, it retrieves the relevant data from the Cluster Manager, performs the optimization, and stores optimization results back to the Cluster Manager. A client can then retrieve the results.
The Jobs Page
The Jobs page in the Cluster Manager looks like this:
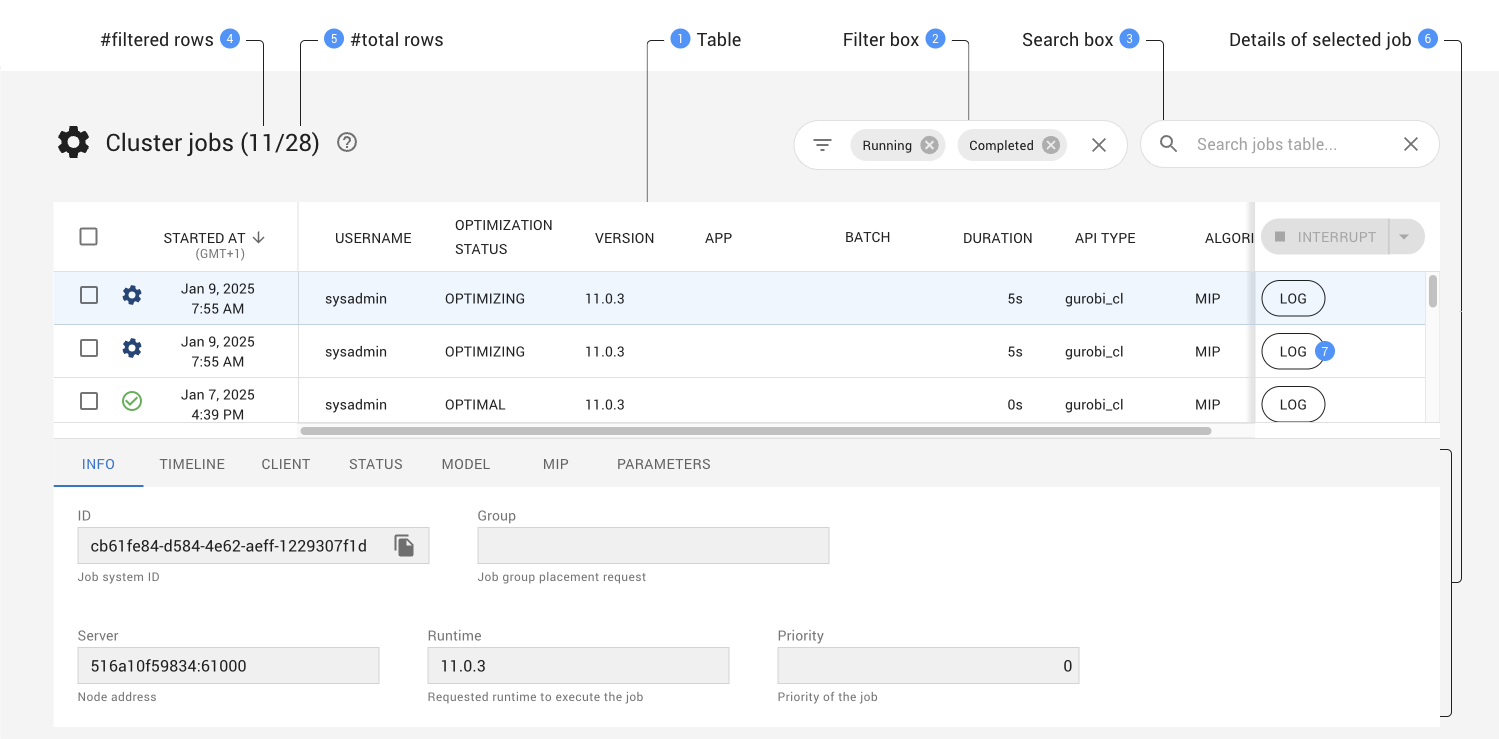
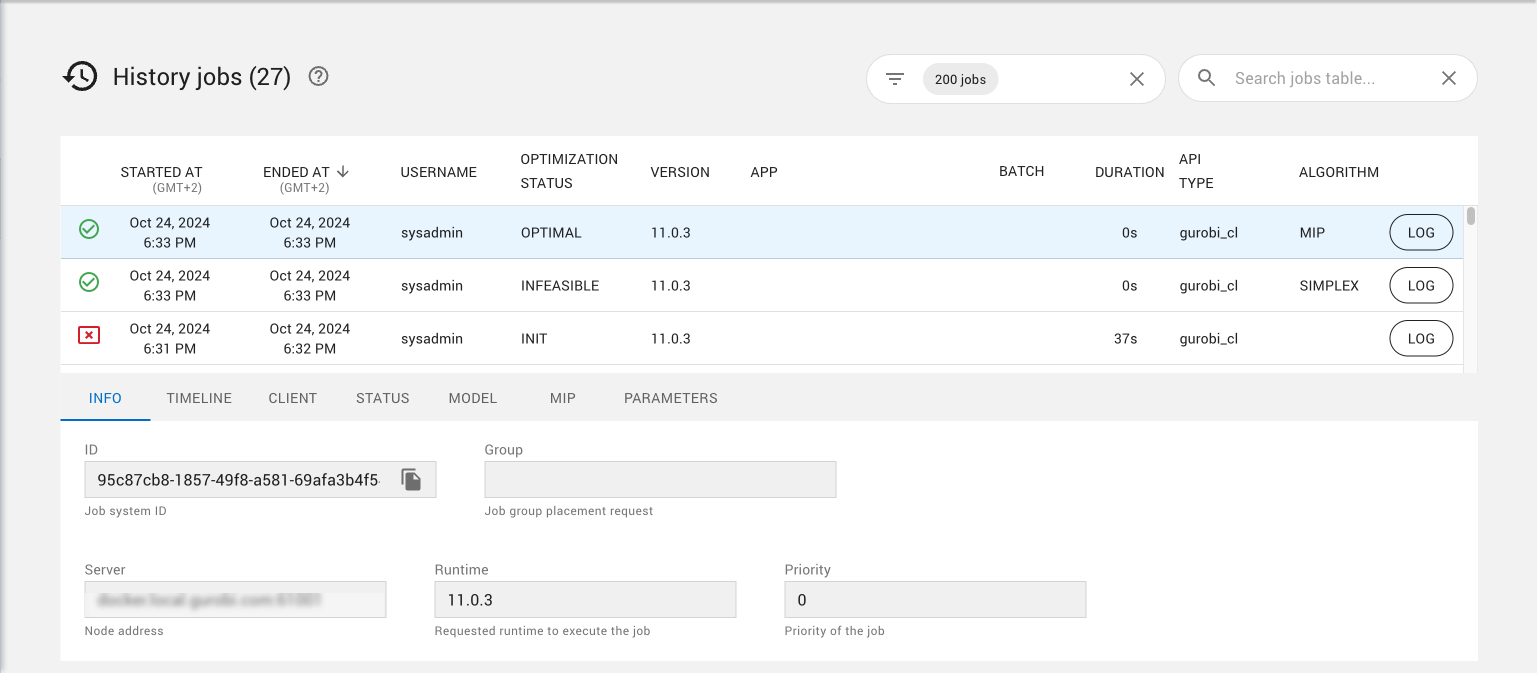
This page shows a table of all jobs that have been created on a Cluster Manager (completed, active, and queued). Each line in the table provides information about a job, including the current status, the creation time, the Gurobi version and algorithm used to solve it, and the API used to create the job. The current job status is shown using an icon:

Job has been queued.

Job is running.

Job has been aborted.

Job has failed.

Job has successfully completed.

Job has been rejected.

Job has been disconnected.

Job has reached the idle timeout.
Jobs can be sorted by various attributes by clicking on the corresponding column headers. Up and down arrow icons allow you to select the sorting direction.
Jobs displayed in the table can be filtered using either the Filter box or the Search box. Details can be found in the Filtering and Searching section.
The number of rows of the table.
When the table has been filtered, two numbers are displayed to the right of the page title showing respectively the number of jobs matching the current filtering and the total number of jobs. If no jobs have been filtered, only the total number of jobs wil be displayed.
When you select a job from the table (highlighted in blue), the tabs below the table allow you to obtain additional information about that job. Choosing a tab brings up the corresponding information. Note that the title of one of the tabs, as well as the information that is displayed under that tab, depends on the optimization algorithm used for that job. Options are
MIP,BARRIER, orSIMPLEX.The LOG button opens a new page displaying a dashboard for the job that includes:
A panel containing the optimization log for that job.
The Objective graph showing the progress of the best objective over the time.
Tabs that provide more details about the job (which are equivalent to tabs shown in (6)
See the Log section for more details.
Filtering and Searching
Jobs displayed in the table can be filtered using the Filter box and the Search box.
Filtering
The Filter box provides the user with a set of predefined filters as shown below:
|
When clicking on the left icon of the filter box, a dialog is displayed to edit the filters to apply. |
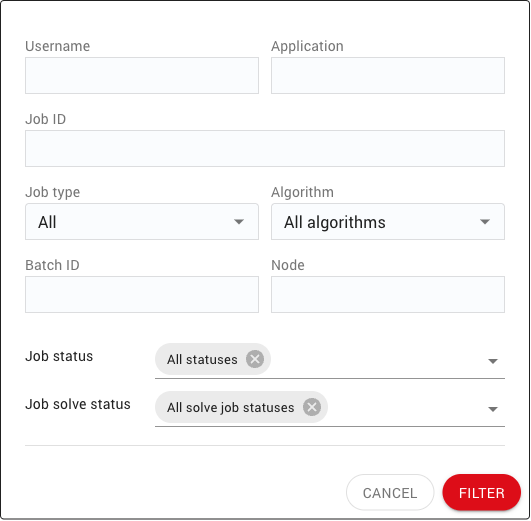
The content of the filter box varies depending on the job page, whether it is the Cluster jobs, Queue or History job page. The following job filters can be found in all or few of the job pages:
Username |
Filter jobs which username matches the specified |
Application |
Filter jobs which application matches the specified Application. The |
Job ID |
Filter the job which ID equals to the specified |
Job limit |
Specify the maximum number of jobs returned by the server. By default, the limit is set to |
Job type |
Filter jobs depending on whether they are associated with a batch or not. Possible filter values are:
|
Algorithm |
Filter jobs depending on the algorithm being applied. Possible values are |
Batch ID |
Filter jobs associated with a batch which ID equals to the specified Batch ID. If the Batch ID field is left empty, no filtering is performed based on the batch ID. |
Node |
Filter jobs which node address matches the specified Node. If the Node field is left empty, no filtering is performed based on the node. |
Job status |
Filter jobs which status matches one of the selected job status. Possible filter values are
|
Solve status |
Filter jobs which solve status matches one of the selected job solve status. Possible filter values are |
Running at |
Filter jobs which where running at a specified date. If the Running at checkbox is unchecked, no filtering is applied for this filter and running at fields are disabled. Otherwise, jobs are filtered if their started date is before or equal to the specified date and if their end date os after the selected date. |
Time range |
Filter jobs which started date are on a specified time range. If the Time range checkbox is unchecked, no filtering is applied on job started date and time range fields are disabled. Otherwise, jobs are filtered if their started date is after the start of the time range and before the end of the time range. The start and end date of the time range are edited with date field respectively left and right to - character. There are few ways for editing the start and end dates:
|
By default, users having one of the roles ADMIN, SYSADMIN, or READONLY will see all jobs. Other users will only see jobs they have launched. This default filter can be changed from the Filter box.
When the table has been filtered, two numbers are displayed to the right of the page title showing respectively the number of jobs matching the current filtering and the total number of jobs. If no jobs have been filtered, only the total number of jobs wil be displayed.
Searching
The Search box enables users to further refine the results by specifying an arbitrary search string. In order for a job to be displayed, the search string must be present in at least one of the columns in the table for that job, or in the job ID or job batch ID.
Note
It is important to note that filtering with the Filter box is usually applied server side, while searching with the Search box is always performed client side. That means that the searching is done on results that were already filtered by the server, so it it is preferable to use the Filter box first and then use the Search box to refine the results. Using the Search box as an alternative to the Filter box could result in missing items.
Synchronization with page URL
The Cluster Manager creates permalinks for all tables that can be filtered or searched. Changes applied using either the Filter or Search boxes are automatically reflected in the page URL, thus allowing you to copy and paste the URL to easily retrieve the same display later. For example, the URL http://localhost:61080/jobs/main?status=RUNNING would display only jobs that are currently running (assuming the Cluster Manager is running on localhost:61080).
Log and Objective
|
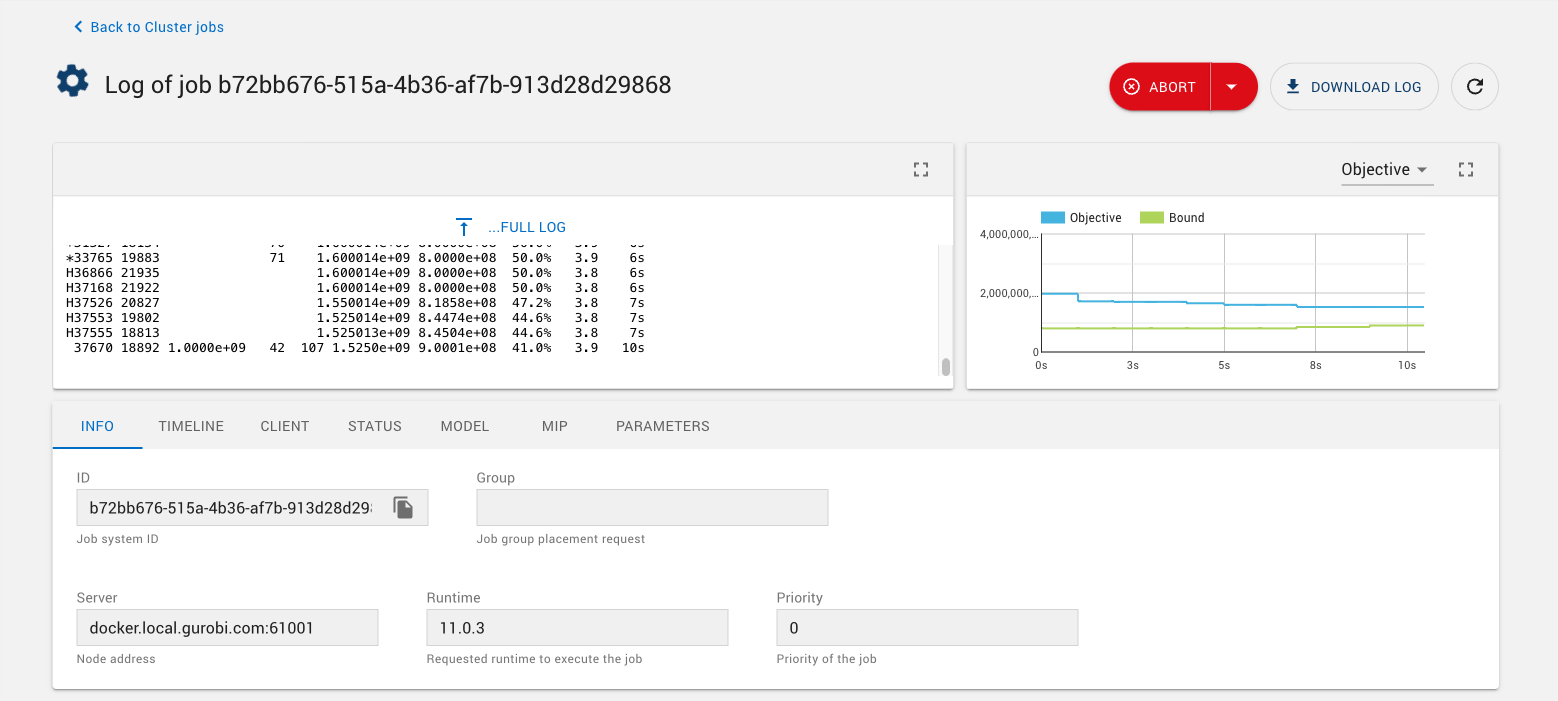
The Log button opens the job dashboard. This page displays the optimization log for the job, as well as an Objective progress chart and a set of tabs that allow you to obtain additional information about the job. |
Log
Within the job dashboard, the Log panel shows the optimization log. If the job is still running, new log text is automatically appended as soon as it is available.
|
If the job ran before you navigated to the Log panel, older log data may not be displayed. The |
|
To download the full job log to a file once the job is completed, click on the |
Objective
The Objective chart shows optimization progress over time by displaying objective values for solutions found by the optimization algorithm. For MIP models, the Objective chart can be switched to show progress in the optimality Gap, using the top-right selection box in the Objective panel.
Aborting Jobs
Jobs can be aborted from the Jobs page with the following steps:
Select the job(s) to be aborted (by clicking on the checkbox on the far left of the job display).
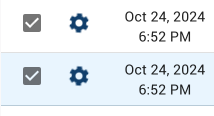
Click the abort button.

Confirm that the selected jobs should be aborted.

Aborted jobs will show a change of status once the abort has been completed and recorded:
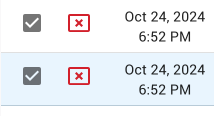
Note
STANDARD users can only abort jobs they launched.
READONLY users cannot abort any jobs.
SYSADMIN and ADMIN users can abort jobs of any users.
Job Queue
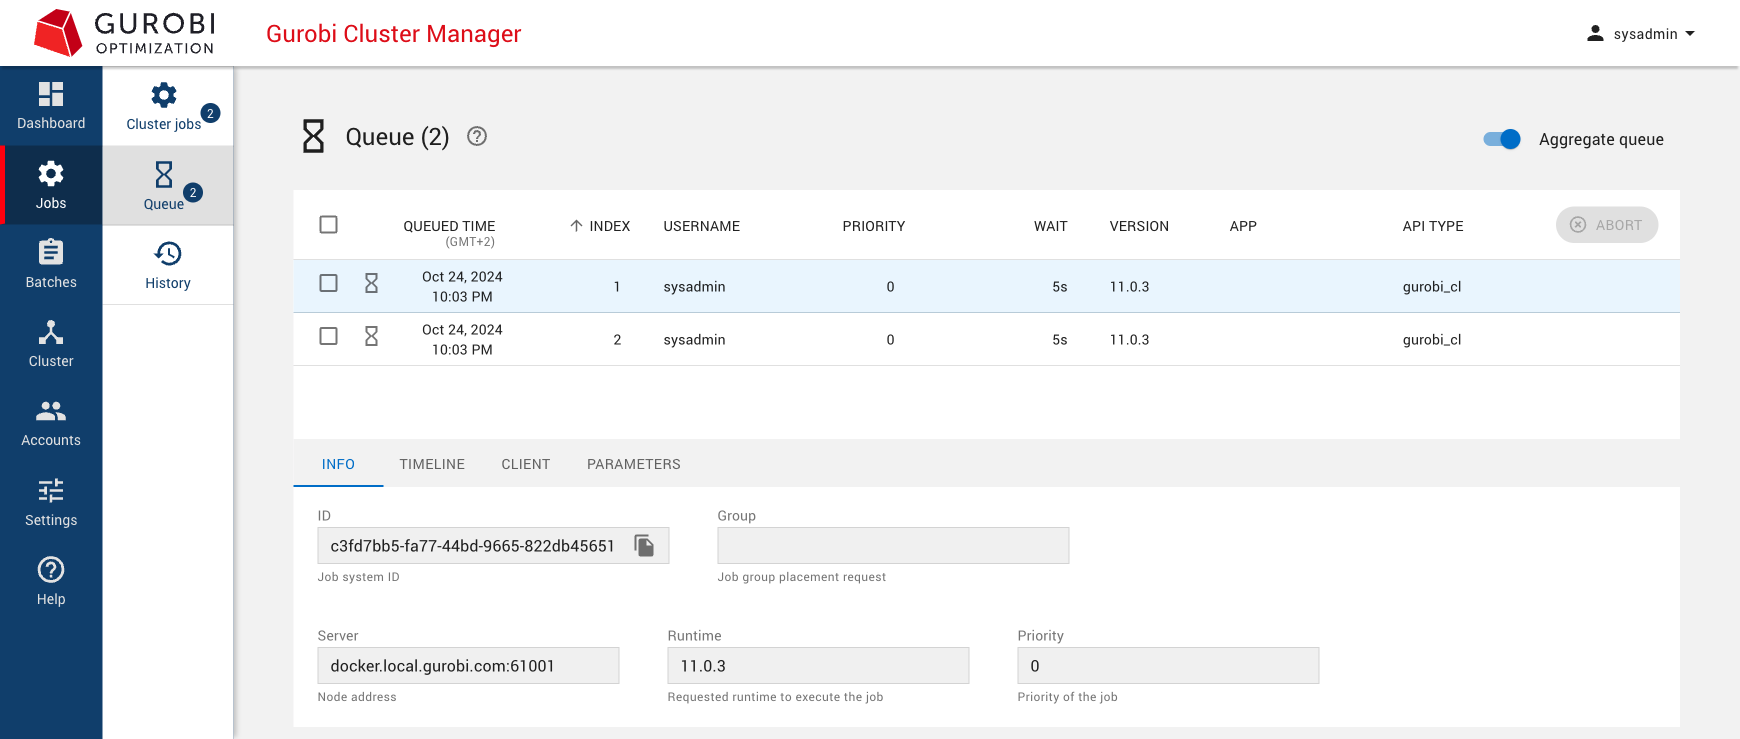
Each Compute Server node has a job limit that constrains the number of jobs that can be run simultaneously. When total available capacity in the cluster has been exhausted, new jobs are queued until capacity becomes available. Queued jobs can be viewed in the Queue page:
|
A queued job is actually queued in all compatible nodes. The Queue page displays an aggregated view by default, showing only the best position for each job across all nodes. Use the Aggregate queue toggle to see the queue for each individual node. |
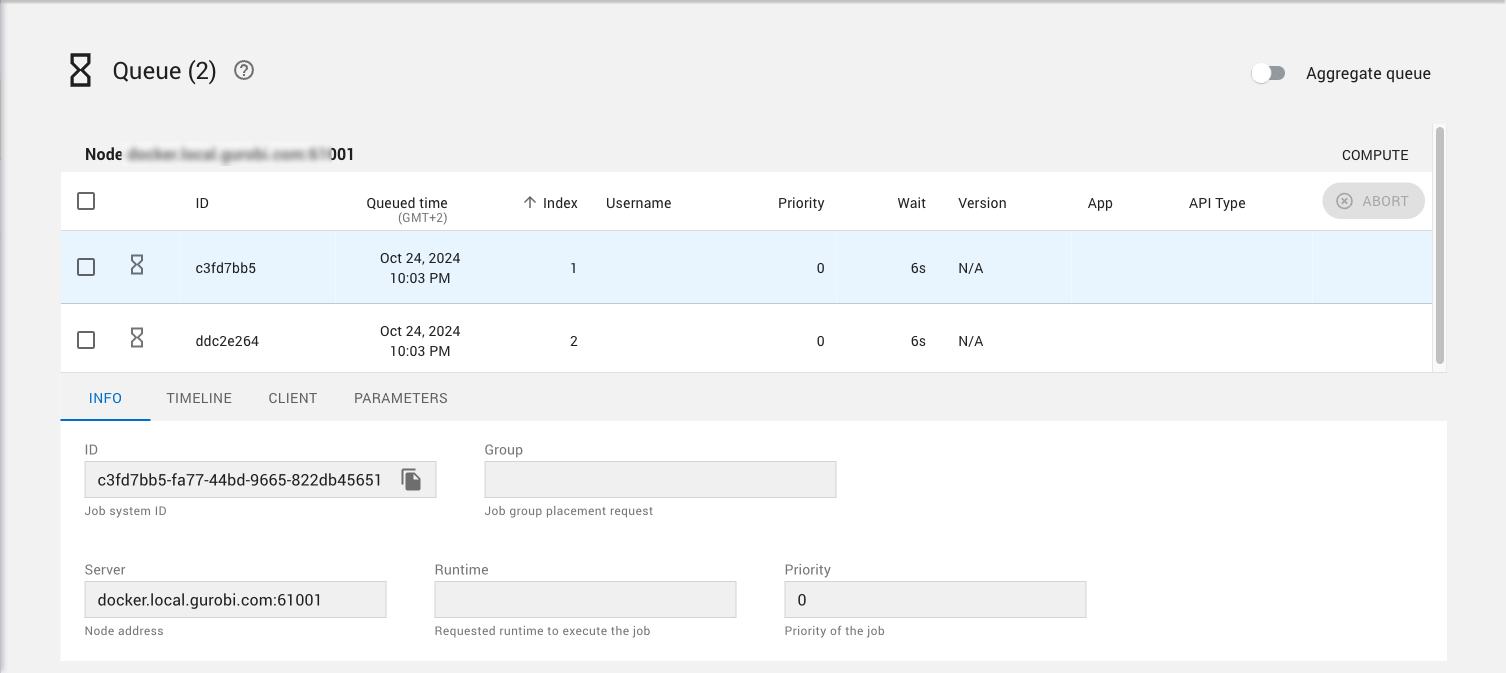
Queued jobs can be aborted, just like jobs in the Cluster Jobs page. Refer to the Abort job(s) section for details.
Job History
The Cluster jobs page displays running jobs and recently completed jobs. The Job history page gives access to all completed jobs up to a limit in time that is controlled with the History expiration setting in the Data Management settings section.
By default, the Cluster manager stores the completed jobs for the past 30 days.
To access this larger set of jobs, the history page extends the filter box of the Cluster job page with more filters including filtering by starting time or for a specific Gurobi runtime. Refer to the Filtering and Searching section for more details.
