Dashboard
Job Dashboard
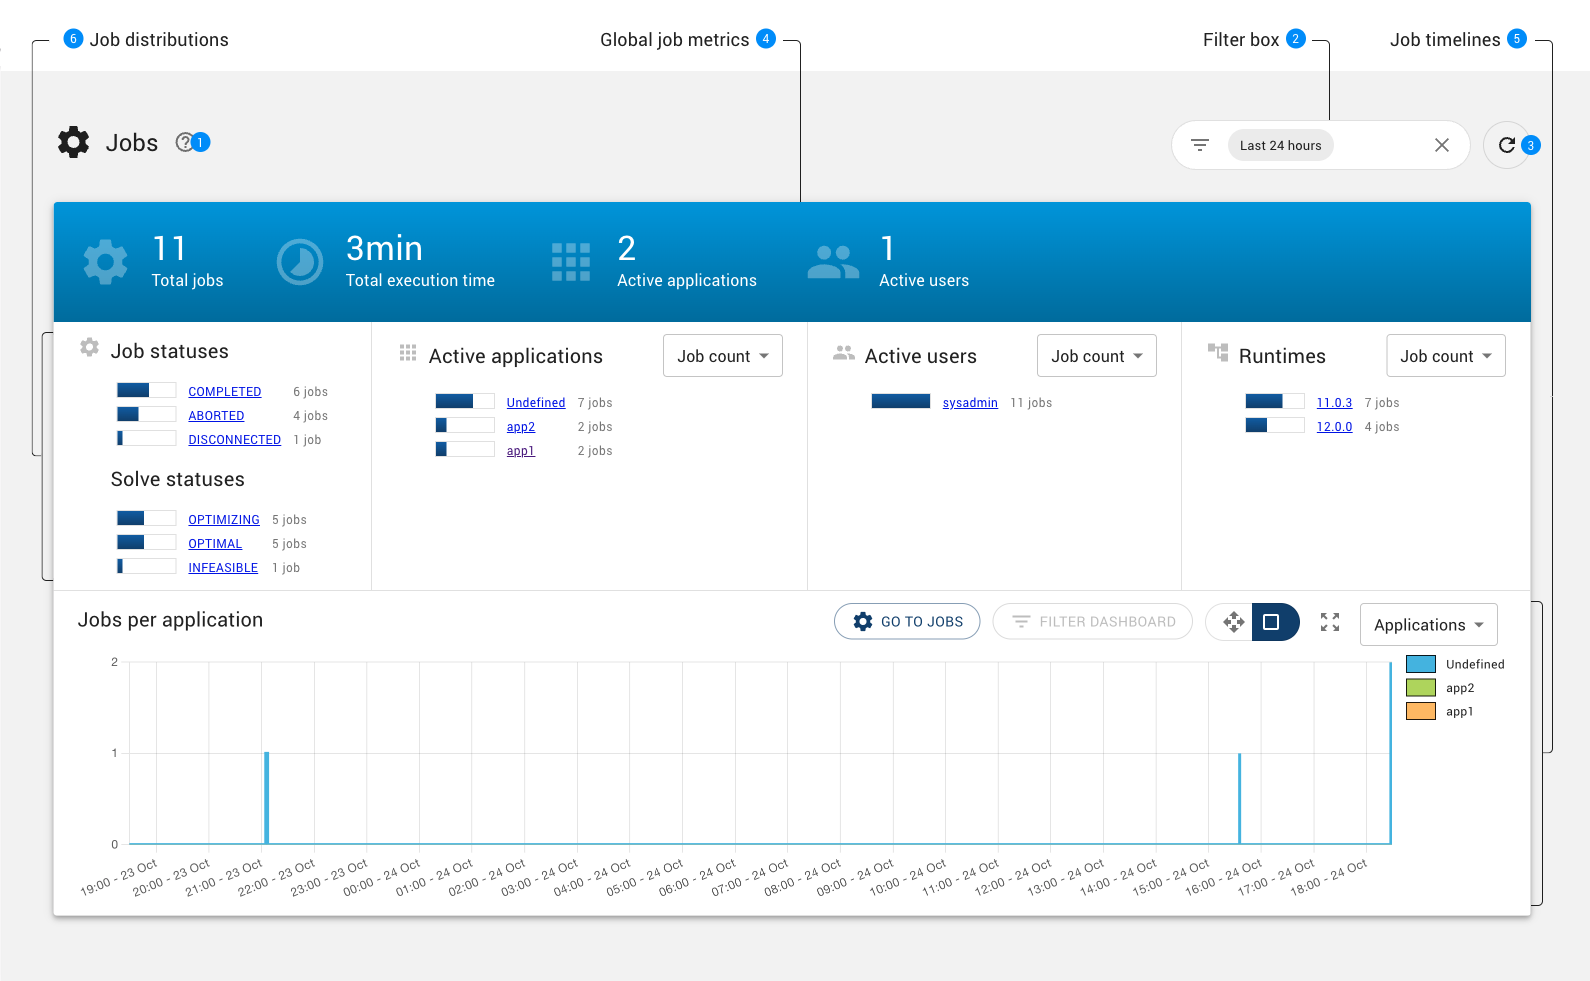
This job dashboard aggregates information about completed jobs according to several dimensions: job statuses, solves statuses, applications, users and runtime versions. It also provides a timeline for these dimensions so that users can track evolution of these metrics over time. The user can zoom or pan into the timeline, and drill down to the actual job list or filter the dashboard.

Help button to navigate to the documentation of the Job dashboard page.
Filter box to select the time range and other criteria to filter the Job dashboard page. Details can be found in the filtering section.
Button to reload the page.
Note that reloading the page is only effective if the selected time range ends the current day.
Global job metrics.
Details can be found in the Global job metrics section.
Job timelines.
Details can be found in the Job timelines section.
Job distribution.
Details can be found in the Job distribution section.
Global job metrics
Main metrics for the job activity for the selected period of time.

Total jobs
Number of jobs that were running in the selected period of time.
Total execution time
Sum of the execution time of all jobs that were running in the selected period of time.
Active applications
Number of applications for the jobs that were running in the selected period of time.
Active users
Number of users who have been running jobs on this cluster in the selected period of time.
Job distribution
This row displays the distributions of jobs according to several dimensions: job statuses, solves statuses, applications, users and runtime versions. For some dimensions, you can select the aggregation by the number of jobs or the total job execution time.

Job statuses
Number of jobs that were running on the selected period of time per status, such as
COMPLETEDorFAILED.Solve statuses
Number of jobs that were running on the selected period of time per solve status, such as
OPTIMALorINFEASIBLE.Active applications
Number of jobs that were running on the selected period of time per application. The drop down (4) at the top right of the chart allows for displaying job execution times instead of number of jobs in the bar chart.
Active users
Number of jobs that were running on the selected period of time per user. The drop down (6) at the top right of the chart allows for displaying job execution times instead of number of jobs in the bar chart.
Runtimes
Number of jobs that were running on the selected period of time per runtime. The drop down (8) at the top right of the chart allows for displaying job execution times instead of number of jobs in the bar chart.
Rows of horizontal bar chart provide a link to the Job History page with a filter set to select the jobs corresponding to the clicked link.
For example, a click on the  job app
 link of the Active applications bar chart will navigate to the Job History page with the application filter set to app1 and the same time range the dashboard page, as illustrated below:

Job timelines
This row displays the selected timeline of the jobs that ran in the selected period of time.

Go to jobs
This button navigates to the Job History page, applying the current filter in the dashboard page and providing the visible time range in the timeline chart as the time range filter for the jobs page.
Filter dashboard
Applies the visible time range in the timeline chart to the filter of the dashboard page.
Zoom features
The timeline chart provides two modes for changing the visible time range of the chart.
Pan, activated with the Pan (3) button In this mode, pressing the left mouse button on the chart and dragging the mouse left of right will scroll horizontally the timeline, unless no zoom in has been performed on the chart.
zoom in to a specified time range, activated with the Drag (4) button.
This mode is selected by default.
In this mode, pressing the left mouse button on the chart and dragging the mouse left of right will select a time range, visible with a blue rectangle. When releasing the left mouse button, the chart will zoom in the zone corresponding to the dragged area.
At any time, you can restore the timeline chart to its initial zoom state clicking the restore zoom (5) button.
To zoom in/zoom out with the mouse wheel, keep the
Ctrlkey pressed while using the mouse wheel.
Timeline selection
The drop down (6) at the top right of the chart allows for selecting the dimension of timelines:
Job applications
Job statuses
Job solve statuses
Job users
Job runtimes
Job solve times
The last choice of the timeline drop down selects a Solve times chart. Each bar of this chart is associated with one job that was running in the selected period of time. The height of the job bar indicates the execution time of the job.
Legend
Different values of the selected timeline are listed with their associated color. In the case of job solve times, there is no legend.
Job filtering
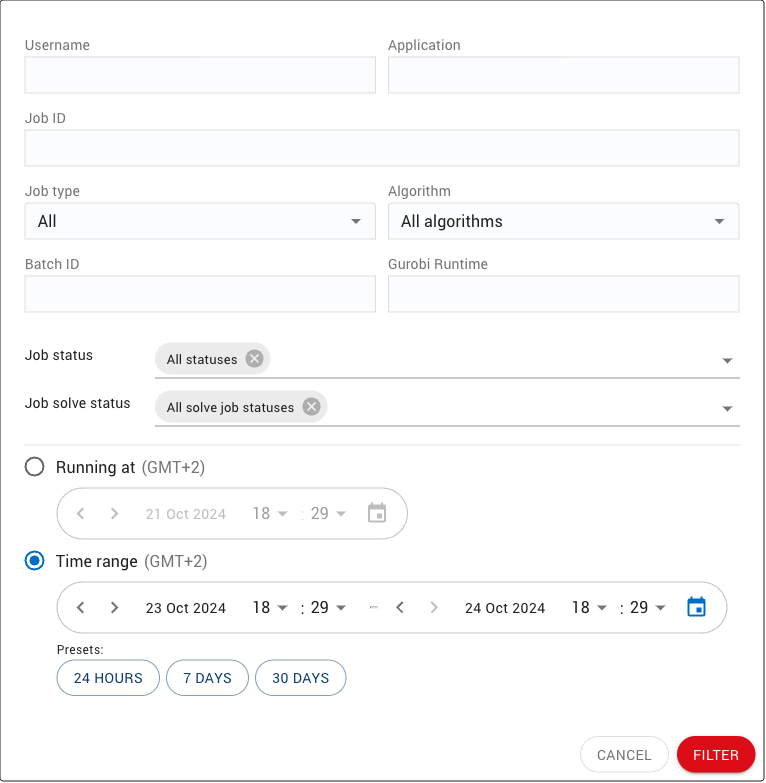
The Filter box provides the user with a set of predefined filters as shown below:
|
When clicking on the left icon of the filter box, a dialog is displayed to edit the filters to apply. |

Here are the details of the filters of the filter box:
Filter |
Description |
|---|---|
Username |
Filter jobs which username matches the specified |
Application |
Filter jobs which application matches the specified Application. The |
Job ID |
Filter the job which ID equals to the specified |
Job type |
Filter jobs depending on whether they are associated with a batch or not. Possible filter values are:
|
Algorithm |
Filter jobs depending on the algorithm being applied. Possible values are |
Batch ID |
Filter jobs associated with a batch which ID equals to the specified Batch ID. If the Batch ID field is left empty, no filtering is performed based on the batch ID. |
Runtime |
Filter jobs associated with a batch a specific runtime. Match can be partial, for example “9.5” will match all the technical releases such as “9.5.1” and “9.5.2”. |
Job status |
Filter jobs which status matches one of the selected job status. Possible filter values are:
|
Solve status |
Filter jobs which solve status matches one of the selected job solve status. Possible filter values are All job solve statuses, |
Running at |
Filter jobs which where running at a specified date that is the jobs started before the selected date and ended after. |
Time range |
Filter jobs which were running during the selected time range that is the jobs started before the selected end date, and ended after the selected start date. The start and end date of the time range are edited with date field respectively left and right to - character. There are few ways for editing the start and end dates:
|
Node dashboard
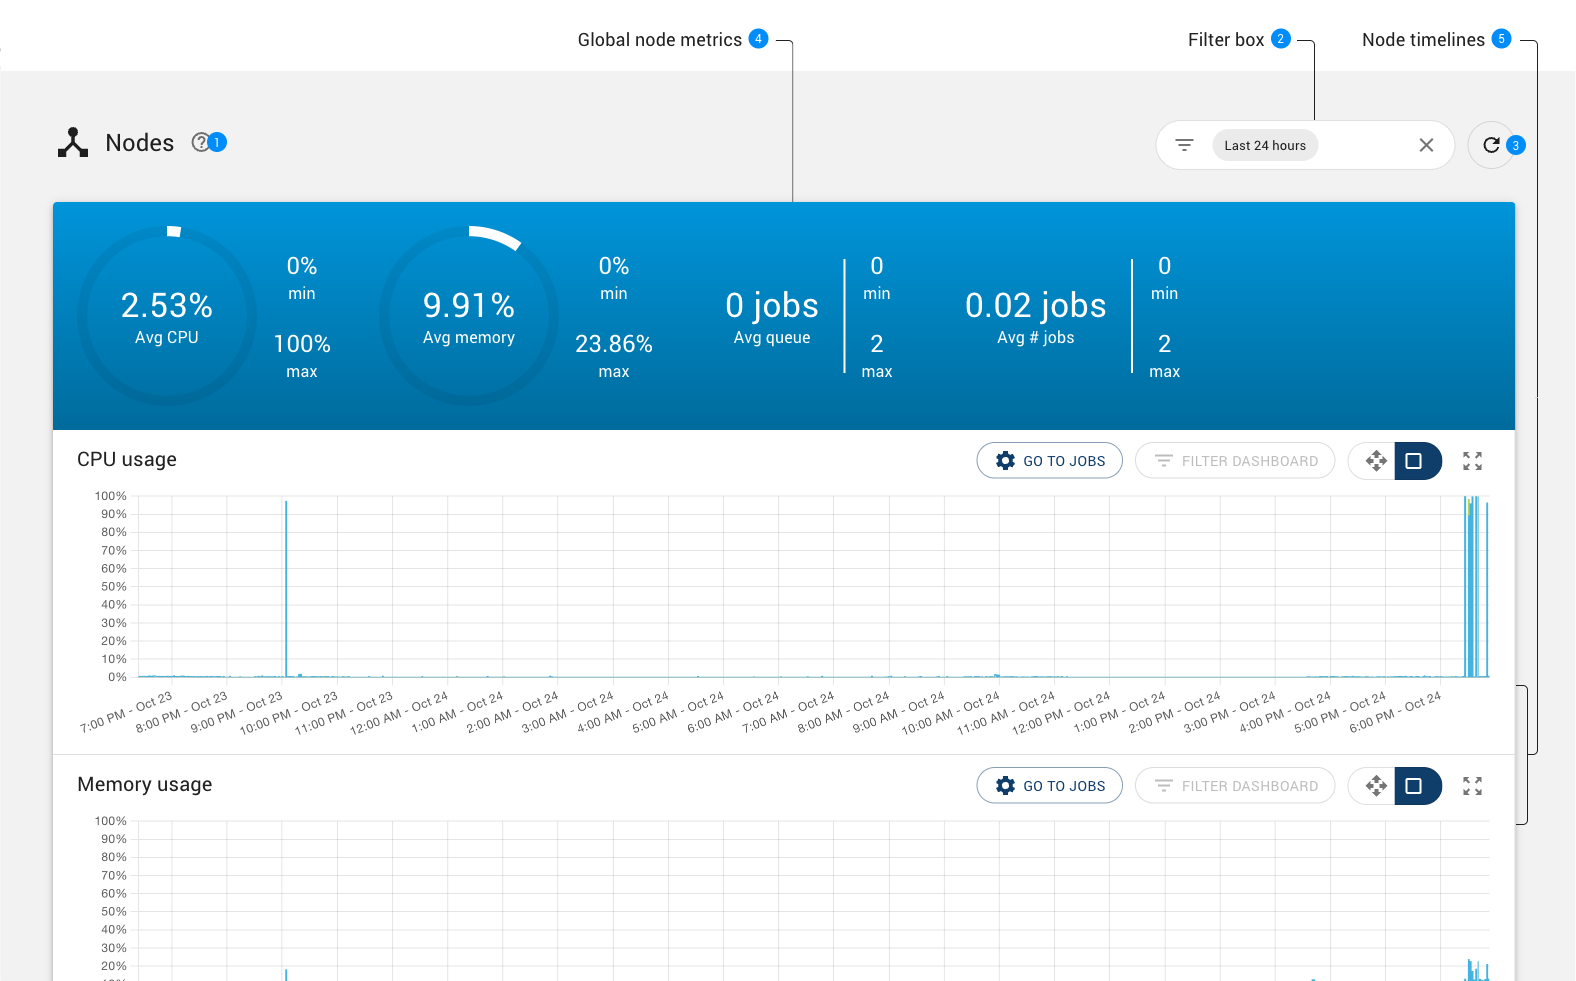
This node dashboard aggregates information about the usage of nodes of this cluster manager according to several dimensions: CPU usage, memory usage, the job queue and jobs that have been running on the cluster nodes. It provides a timeline for these dimensions so that users can track evolution of these metrics over time. The user can zoom or pan into the timeline, and drill down to the actual job list or filter the dashboard.

Help button to navigate to the documentation of the Node dashboard page.
Filter box to select the time range to filter the Node dashboard page. Details can be found in the Filtering nodes section.
Button to reload the page.
Note that reloading the page is only effective if the selected time range ends the current day.
Global node metrics.
Details can be found in the Global node metrics section.
Node timelines.
Details can be found in the Node timelines section.
Global node metrics
Main metrics for the activity of nodes for the selected period of time.

CPU Usage
Average (1), minimum (2) and maximum (3) CPU usage for the selected period of time.
Memory usage
Average (4), minimum (5) and maximum (6) memory usage for the selected period of time.
Queue
Average (7), minimum (8) and maximum (9) number of jobs in the queue for the selected period of time.
Number of jobs
Average (10), minimum (11) and maximum (12) number of jobs running on the cluster nodes for the selected period of time.
Node timelines
This section displays a list of timelines that each shows the evolution of one node metric overtime, such as the CPU or memory usage.
Node timelines are synchronized with each others. If one timeline is zoomed in into a specific time range, other timelines are automatically zoomed in to same time range. This allows the user to always get a full overview of the node activity when zooming in into a time range of interest.
Node timeline features

Go to jobs
This button navigates to the Job History page, applying the current visible time range in the timeline chart as the time range filter for the jobs page.
Filter dashboard
Applies the current visible time range in the timeline chart to the filter of the dashboard page.
Zoom features
The timeline chart provides two modes for changing the visible time range of the chart.
Pan, activated with the Pan (3) button In this mode, pressing the left mouse button on the chart and dragging the mouse left of right will scroll horizontally the timeline, unless no zoom in has been performed on the chart.
zoom in to a specified time range, activated with the Drag (4) button
This mode is selected by default.
In this mode, pressing the left mouse button on the chart and dragging the mouse left of right will select a time range, visible with a blue rectangle. When releasing the left mouse button, the chart will zoom in the zone corresponding to the dragged area.
At any time, you can restore the timeline chart to its initial zoom state clicking the restore zoom (5) button.
To zoom in/zoom out with the mouse wheel, keep the Ctrl key pressed while using the mouse wheel.
Node filtering
The Filter box provides the user with a set of predefined filters as shown below:
|
When clicking on the left icon of the filter box, a dialog is displayed to edit the filters to apply. |

Here are the details of the filters of the filter box:
Filter |
Description |
|---|---|
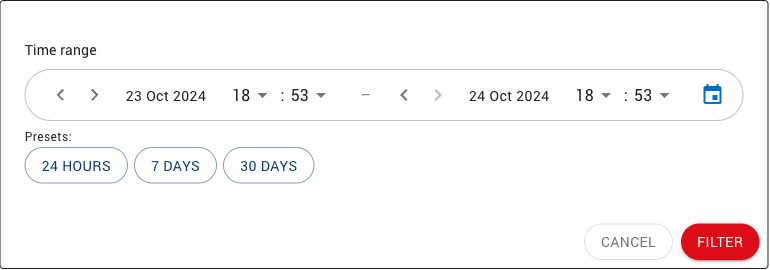
Time range |
Filter node usage on a specified time range. There are few ways for editing the start and end dates:
|
